Proxmox Virtual Environment (PVE) is a powerful open-source virtualization platform, and monitoring it effectively is crucial for maintaining a healthy infrastructure. However, a common challenge is that intentionally stopped VMs can trigger unwanted warnings, cluttering your dashboard.
This guide shows you how to set up comprehensive Proxmox monitoring in PRTG Network Monitor using an advanced PowerShell script that lets you acknowledge intentionally stopped VMs, keeping your sensors green unless there’s a real issue.
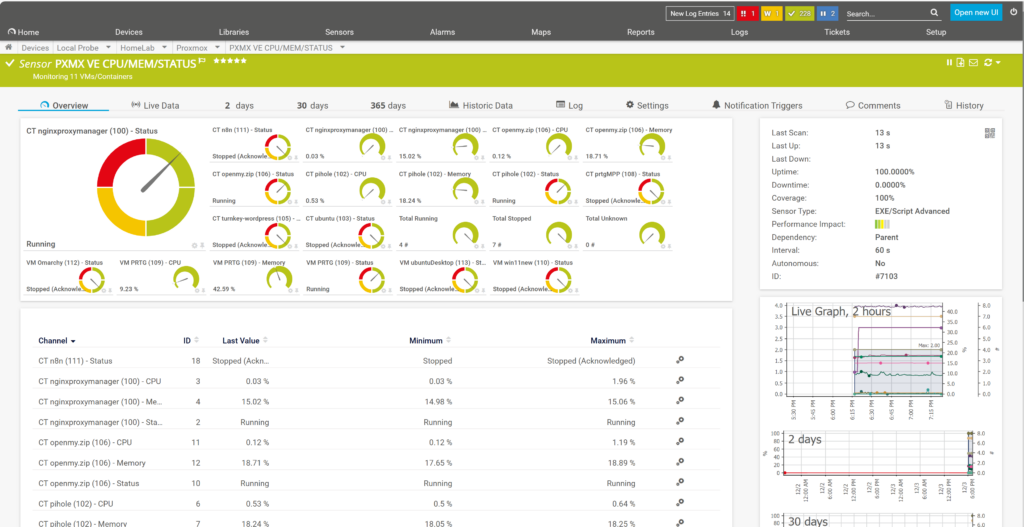
What You’ll Monitor
- VM and Container Status – Running, Stopped, or Unknown with color-coded states.
- Acknowledged State – Keep the sensor “OK” for VMs and containers that are intentionally stopped.
- CPU Usage – Per VM/Container percentage.
- Memory Usage – Per VM/Container percentage.
- Totals – Counts of running, stopped, and unknown instances.
Prerequisites
1. PowerShell 7
PRTG runs PowerShell 5 by default, but our script requires PowerShell 7 for the Proxmox API module.
Download and install from: https://aka.ms/powershell-release?tag=lts
Install to the default location:
C:\Program Files\PowerShell\7\pwsh.exe2. Proxmox API Module
Open PowerShell 7 as an Administrator and install the Corsinvest module for all users:
pwsh.exe
Install-Module Corsinvest.ProxmoxVE.Api -Scope AllUsers
3. Proxmox API Token
Create a dedicated user and an API token in Proxmox:
- Go to Datacenter → Permissions → Users and create a user (e.g.,
prtg@pve). Grant it the `PVEAuditor` role on `/`. - Go to Datacenter → Permissions → API Tokens.
- Click Add and select the user you just created (e.g.,
prtg@pve). - Enter a Token ID (e.g.,
prtg-token) and uncheck “Privilege Separation”. - Copy the full token string (
user@realm!tokenid=token-value). You will only see the secret value once!
Example:
prtg@pve!prtg-token=4cf286c1-b8e3-4e12-a7ce-67fb97e0efc8Installation
Step 1: Download the PowerShell Script
Download the updated script and save it to your PRTG Probe’s custom sensor directory:
C:\Program Files (x86)\PRTG Network Monitor\Custom Sensors\EXEXML\PRTG-PVE-Individual.ps1Step 2: Create the Custom Lookup File
This lookup file tells PRTG how to interpret the status values from our script, including our new “Acknowledged” state.
Save the following XML content to:
C:\Program Files (x86)\PRTG Network Monitor\lookups\custom\prtg.custom.proxmox.vmstatus.ovl<?xml version="1.0" encoding="UTF-8"?>
<ValueLookup id="prtg.custom.proxmox.vmstatus" desiredValue="2" undefinedState="Warning" xmlns:xsi="http://www.w3.org/2001/XMLSchema-instance" xsi:noNamespaceSchemaLocation="PaeValueLookup.xsd">
<Lookups>
<SingleInt state="Ok" value="2">Running</SingleInt>
<SingleInt state="Warning" value="1">Stopped</SingleInt>
<SingleInt state="Ok" value="3">Stopped (Acknowledged)</SingleInt>
<SingleInt state="Error" value="0">Unknown</SingleInt>
</Lookups>
</ValueLookup>Step 3: Load the Lookup in PRTG
- In PRTG, go to Setup → System Administration → Administrative Tools.
- Click Load Lookups and wait for the confirmation.
Step 4: Create the Sensor in PRTG
- Navigate to your Proxmox device in PRTG.
- Click Add Sensor and choose EXE/Script Advanced.
- Configure the sensor settings:
| Setting | Value |
|---|---|
| Name | Proxmox VMs & Containers |
| EXE/Script | PRTG-PVE-Individual.ps1 |
| Parameters | -Server "10.0.0.1" -APITOKEN "prtg@pve!prtg-token=xxx" -SkipCertCheck -AcknowledgedStopped 103 105 |
| Timeout | 60 seconds |
How to Acknowledge Stopped VMs
When a new, unacknowledged VM is stopped, the sensor will turn yellow (Warning). To acknowledge it and return the sensor to green:
- Identify the ID of the stopped VM or container.
- In PRTG, go to the sensor’s Settings tab.
- Find the Parameters field.
- Add the new ID to the end of the
-AcknowledgedStoppedlist, separated by a space. - Click Save. The sensor will turn green on the next scan.
Script Parameters
| Parameter | Description | Example |
|---|---|---|
-Server | Proxmox server IP or hostname. | "10.0.0.1" |
-APITOKEN | Full API token string. | "prtg@pve!token=xxx" |
-AcknowledgedStopped | Space-separated list of VMIDs to treat as OK when stopped. Do not use quotes. | 101 104 205 |
-SkipCertCheck | Skip SSL certificate validation (use for self-signed certs). | (switch) |
-IncludeName | Regex to include VMs by name. | "prod\|web" |
-ExcludeName | Regex to exclude VMs by name. | "test\|dev" |
-IncludeType | Include only qemu (VMs) or lxc (Containers). | "lxc" |
Status Colors in PRTG
| Status | Value | Color | Meaning |
|---|---|---|---|
| Running | 2 | 🟢 Green | The VM/Container is running normally. |
| Stopped (Acknowledged) | 3 | 🟢 Green | The VM/Container is intentionally stopped. |
| Stopped | 1 | 🟡 Yellow | An unexpected VM/Container has stopped. |
| Unknown | 0 | 🔴 Red | The status could not be determined. |
Troubleshooting
Acknowledged VMs still cause a warning
This usually happens because of how PRTG passes parameters. Ensure your
-AcknowledgedStopped list is a set of numbers separated by spaces, with no commas and no quotes around the list.“Lookup value” errors in the sensor status
PRTG caches channel information. If you added the sensor *before* loading the lookup file, it won’t know what to do with the status values. Delete the sensor, reload lookups again, and then re-create the sensor.
Module not found error
Run this command in an administrative PowerShell 7 window to ensure the module is installed correctly for all users:
Install-Module Corsinvest.ProxmoxVE.Api -Scope AllUsers -ForceConclusion
With this improved script and lookup configuration, you gain powerful and, more importantly, practical insight into your Proxmox environment. By acknowledging intentionally stopped machines, you ensure that your PRTG dashboard only alerts you when there’s an actual, unexpected issue, making your monitoring far more efficient.
Leave a Reply